
Our Services
We help businesses make smart, data-driven decisions by translating their data into meaningful and actionable information.

Data Analytics
We assist businesses from a variety of industries to integrate, combine, and analyze diverse data types from multiple data sources to meet their specific needs.

Audit Assistance
We provide Computer Assisted Audit Techniques or CAATs by using computer software to query business data to produce reports that will enhance and assist an audit.

KPI Tracking
Measuring key performance indicators (KPIs) we use your available business data and turn it into practical metrics that can be measured and reported on in informative charts and dashboards.

Data integrity checking
Ensuring your business data is authentic, accurate and consistent so your information is of the highest quality. This will ensure effective use for your business decisions.

Management Reporting
We aim to build management reports to inform managers of different parts of the business to help them make better-informed business decisions by collecting data from various departments and providing the data and KPIs to them in an understandable way.

Data visualisation
Using visual elements like charts, graphs, and maps we visually represent your information and data so you can better understand trends, outliers and patterns in your data.

Everything Starts With an understanding of the foundation of our data
As the world becomes more data-driven, storytelling through data analysis is becoming a vital component and aspect of large and small businesses.
While the process of data analysis focuses on the tasks of cleaning, modeling, and visualizing data, the concept of data analysis and its importance to business should not be understated. To analyze data, core components of analytics are divided into the following categories:
Descriptive analytics
Descriptive analytics help answer questions about what has happened based on historical data. Descriptive analytics techniques summarize large datasets to describe outcomes to stakeholders.
By developing key performance indicators (KPIs), these strategies can help track the success or failure of key objectives. Metrics such as return on investment (ROI) are used in many industries, and specialized metrics are developed to track performance in specific industries.
An example of descriptive analytics is generating reports to provide a view of an organization’s sales and financial data.
Diagnostic analytics
Diagnostic analytics help answer questions about why events happened. Diagnostic analytics techniques supplement basic descriptive analytics, and they use the findings from descriptive analytics to discover the cause of these events. Then, performance indicators are further investigated to discover why these events improved or became worse. Generally, this process occurs in three steps:
- Identify anomalies in the data. These anomalies might be unexpected changes in a metric or a particular market.
- Collect data that’s related to these anomalies.
- Use statistical techniques to discover relationships and trends that explain these anomalies.
Predictive analytics
Predictive analytics help answer questions about what will happen in the future. Predictive analytics techniques use historical data to identify trends and determine if they’re likely to recur. Predictive analytical tools provide valuable insight into what might happen in the future. Techniques include a variety of statistical and machine learning techniques such as neural networks, decision trees, and regression.
Prescriptive analytics
Prescriptive analytics help answer questions about which actions should be taken to achieve a goal or target. By using insights from predictive analytics, organizations can make data-driven decisions. This technique allows businesses to make informed decisions in the face of uncertainty. Prescriptive analytics techniques rely on machine learning as one of the strategies to find patterns in large datasets. By analyzing past decisions and events, organizations can estimate the likelihood of different outcomes.
Cognitive analytics
Cognitive analytics attempt to draw inferences from existing data and patterns, derive conclusions based on existing knowledge bases, and then add these findings back into the knowledge base for future inferences, a self-learning feedback loop. Cognitive analytics help you learn what might happen if circumstances change and determine how you might handle these situations.
Inferences aren’t structured queries based on a rules database; rather, they’re unstructured hypotheses that are gathered from several sources and expressed with varying degrees of confidence. Effective cognitive analytics depend on machine learning algorithms, and will use several natural language processing concepts to make sense of previously untapped data sources, such as call center conversation logs and product reviews.

Data Driven
Let us help you use your company’s data and transform it into actionable insights that can help you grow and reach your business goals by implementing and optimising modern BI solutions.
- Automate manual processes
- Turn data into insight
- Improve data quality
- Predict trends an behaviour
Data Visualisation and reporting services
Modern BI tools provide transformative data visualisation and reporting capabilities that will help your business grow:
- Enable faster and smarter decision making
- Discover patterns in your data
- Make informed decisions based on facts
- Identify what action needs to be taken
- Combine data sets and automate manual processes
- Improve data quality and accuracy
- Enable data discovery
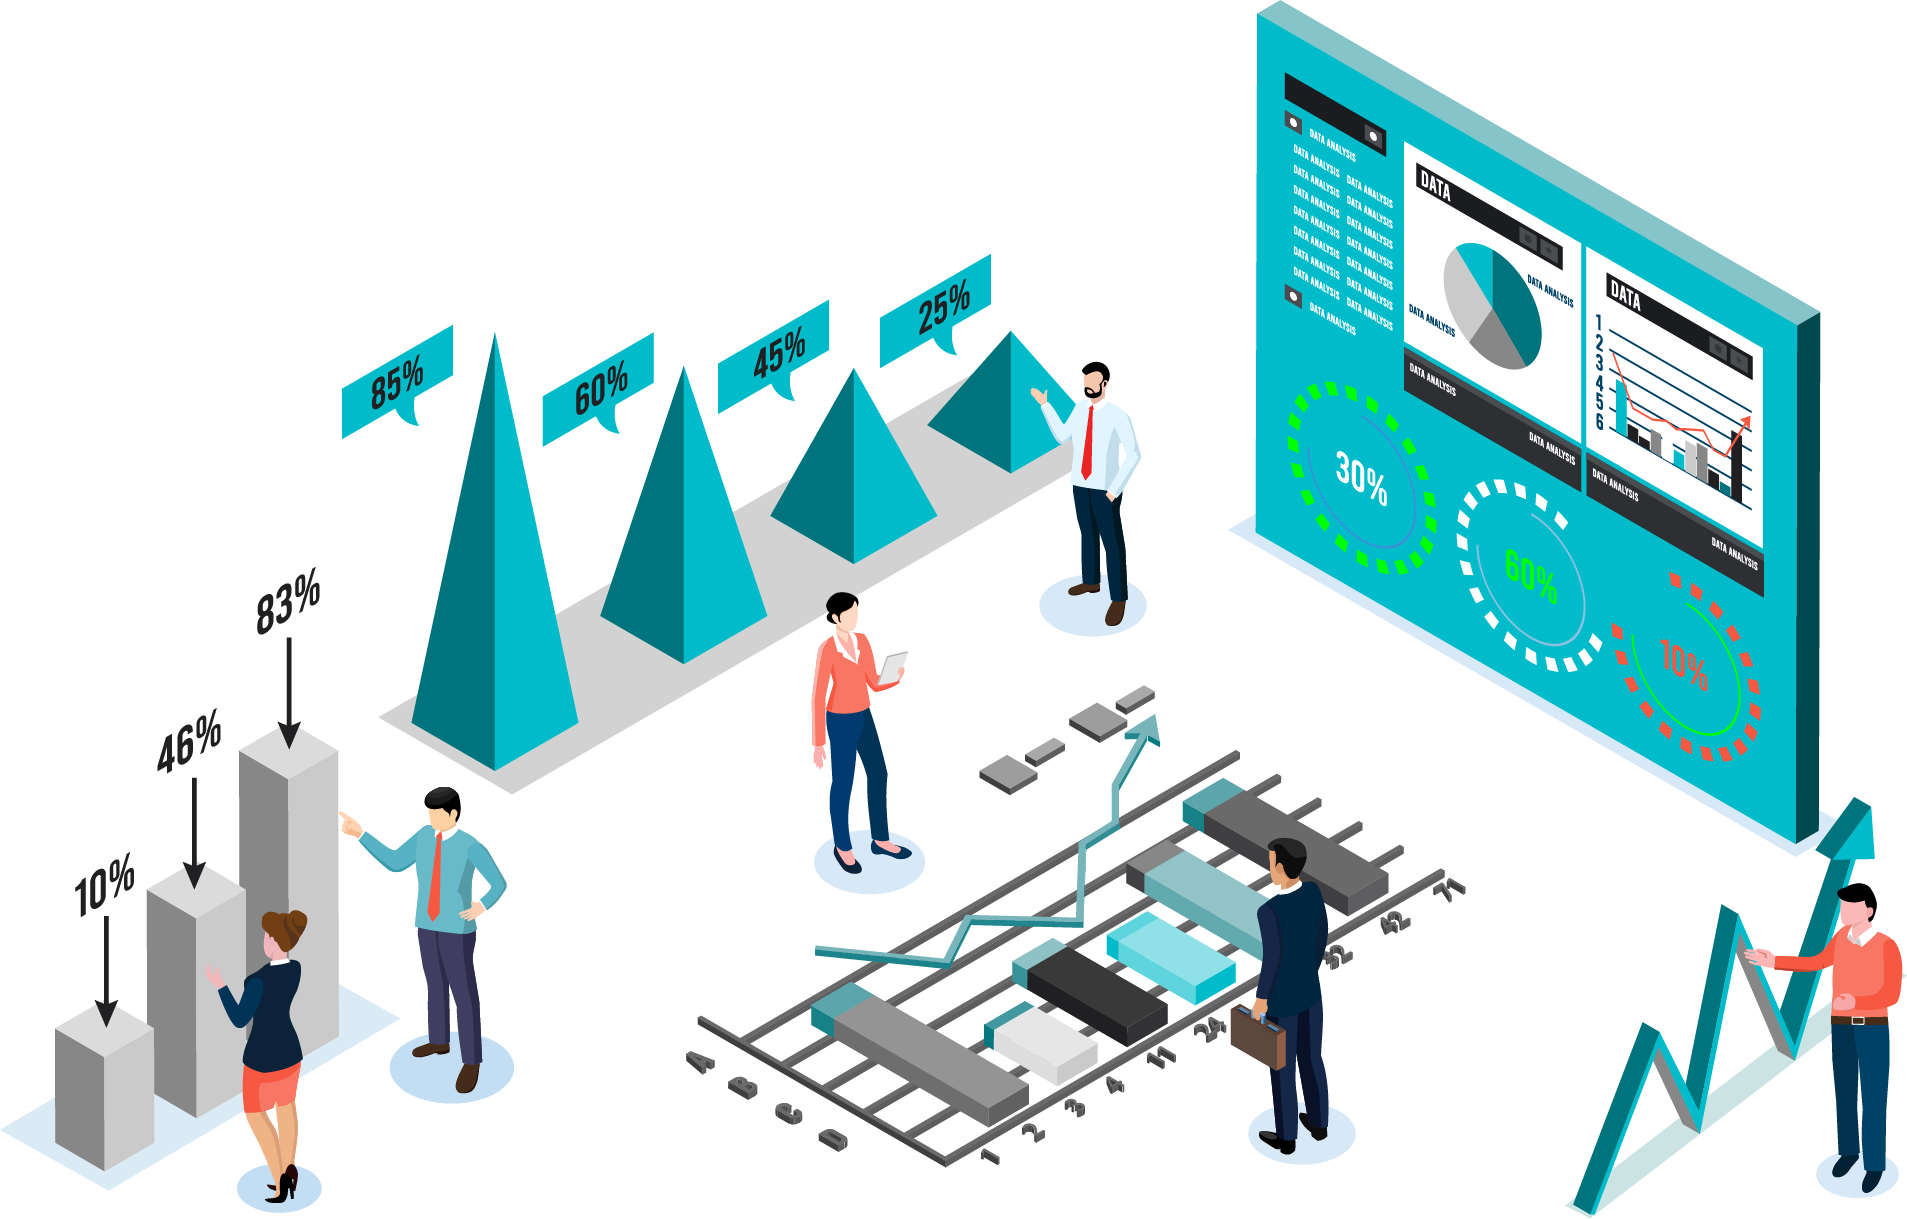

Analytics Project Flow
Every project is unique and different, but a typical engagement with us will follow this process that will ensure everything is done right so that you will end up with an analytics solution that gives you what you need and sets you up for long-term success.
Requirements and data gathering
With an understanding of your organizational goals, we profile source data to understand context.
Data modeling design
We setup, design, and develop the dimensional model, and then test it to ensure the defined KPIs and metrics are valid.
UI/UX Design
We take an iterative approach to design, providing an initial prototype, and then refining your product through end-user testing cycles before delivering the final product.
Training and support
Once finished we provide process documentation to the customer and offer training for the end user. We also provide support for the solutions we deliver.
Have a project in mind or don’t know how to start?
Get in touch today and we can help you make the most of your data to grow your business to it’s full potential.